Skip to content
Selected work / UI/UX & product design

Systematic
Ventures.

A connected platform for founders and investors.

Fintech / investment platform12 weeksUnited States · RemoteUI/UX & product design
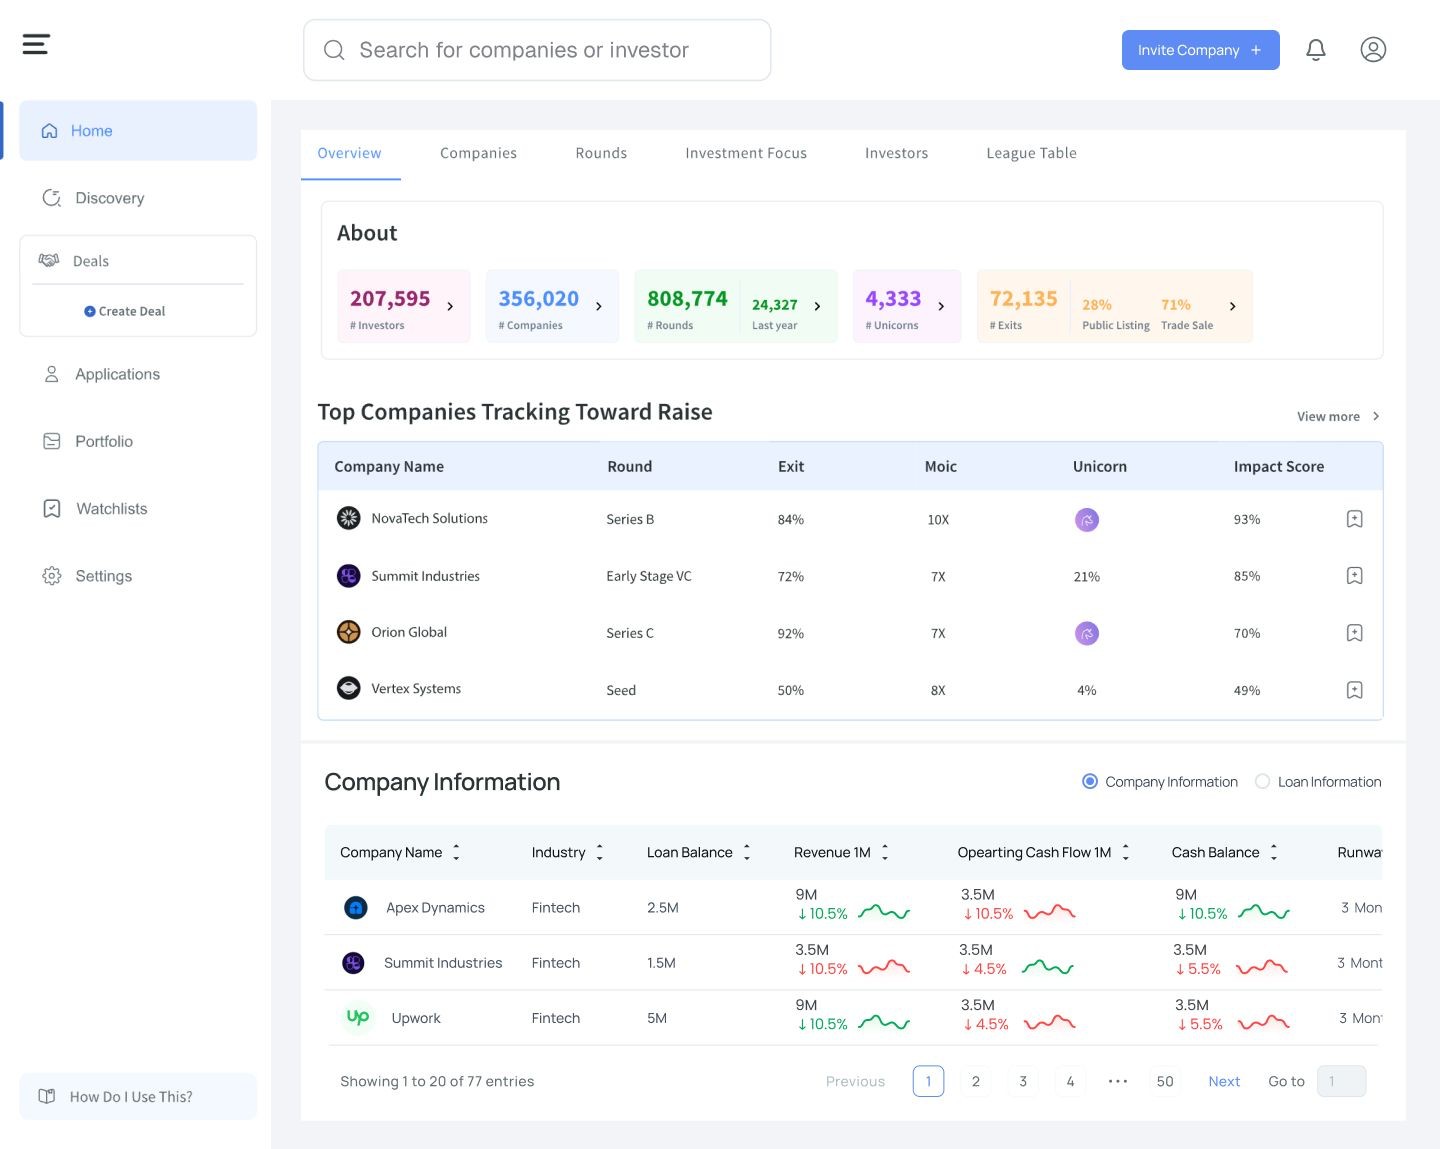
Systematic Ventures investor overview dashboard with company discovery and financial information
Investor overview dashboardSupplied interface design · illustrative data
The project

Information.
Connected.

A two-sided marketplace connecting startups and venture capitalists.

Systematic Ventures required a complete UI/UX design, from concept to final handoff, with distinct experiences for founders and investors.

The work brings applications, documents, financial information, deal discovery, and portfolio management into a consistent, scalable interface.

Founder & investor experiencesUser research & architectureFinancial data presentationResponsive interface designInteractive prototypesDesign system & handoff
The problem

Two audiences.
One financial platform.

Evaluating an investment brings together company background, funding, financial information, comparative scores, and news. When those details are difficult to navigate or compare, the interface creates extra work for the investor.

Founders need to track applications, share documents, and connect with investors. Investors need to discover, compare, and manage opportunities. The design also needed to establish visual trust and accommodate future features.

The design challenge: create distinct founder and investor journeys while making complex financial information clear, trustworthy, and scalable.

The solution

One portal.
Clear paths through the detail.

The design separates founder and investor workflows while connecting them through a shared visual language, structured information, and reusable components. The featured screens show company discovery, investment insights, and transaction management; the wider design scope also includes founder and administrative workflows.

Discover → Review → Compare → Manage
01 / Discovery

Where do investors start?

Problem: A large set of companies and investment information needs a clear entry point.

Design response: Global search, overview tabs, company tables, and watchlist controls organize discovery and provide routes into company detail.
02 / Company context

Bring the company story together.

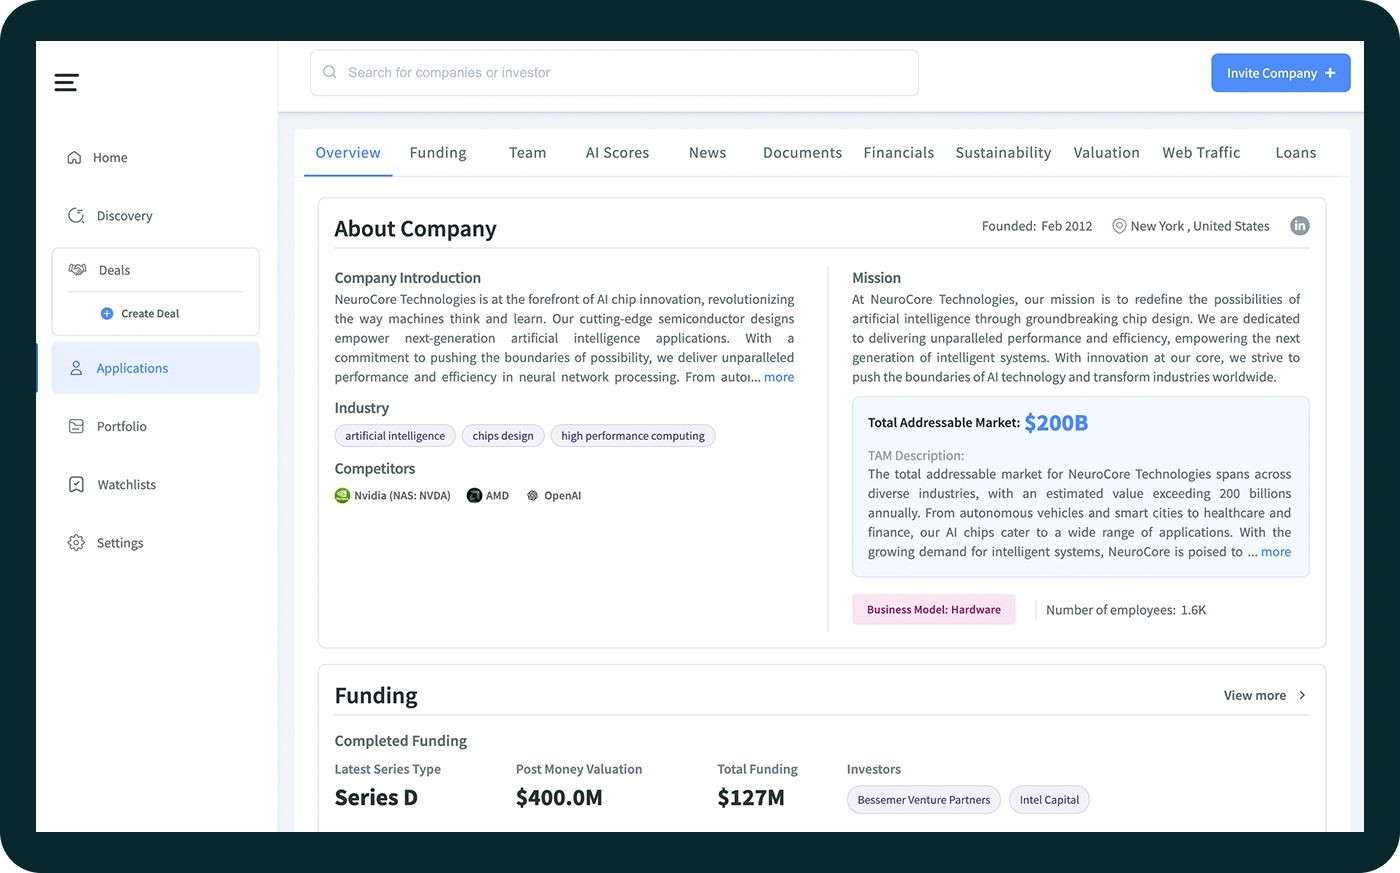
Problem: Background, funding, and business information can be difficult to review as disconnected details.

Design response: A tabbed company profile groups the introduction, mission, industry, competitors, funding, documents, and financial information.

03 / Interpretation

Give scores their context.

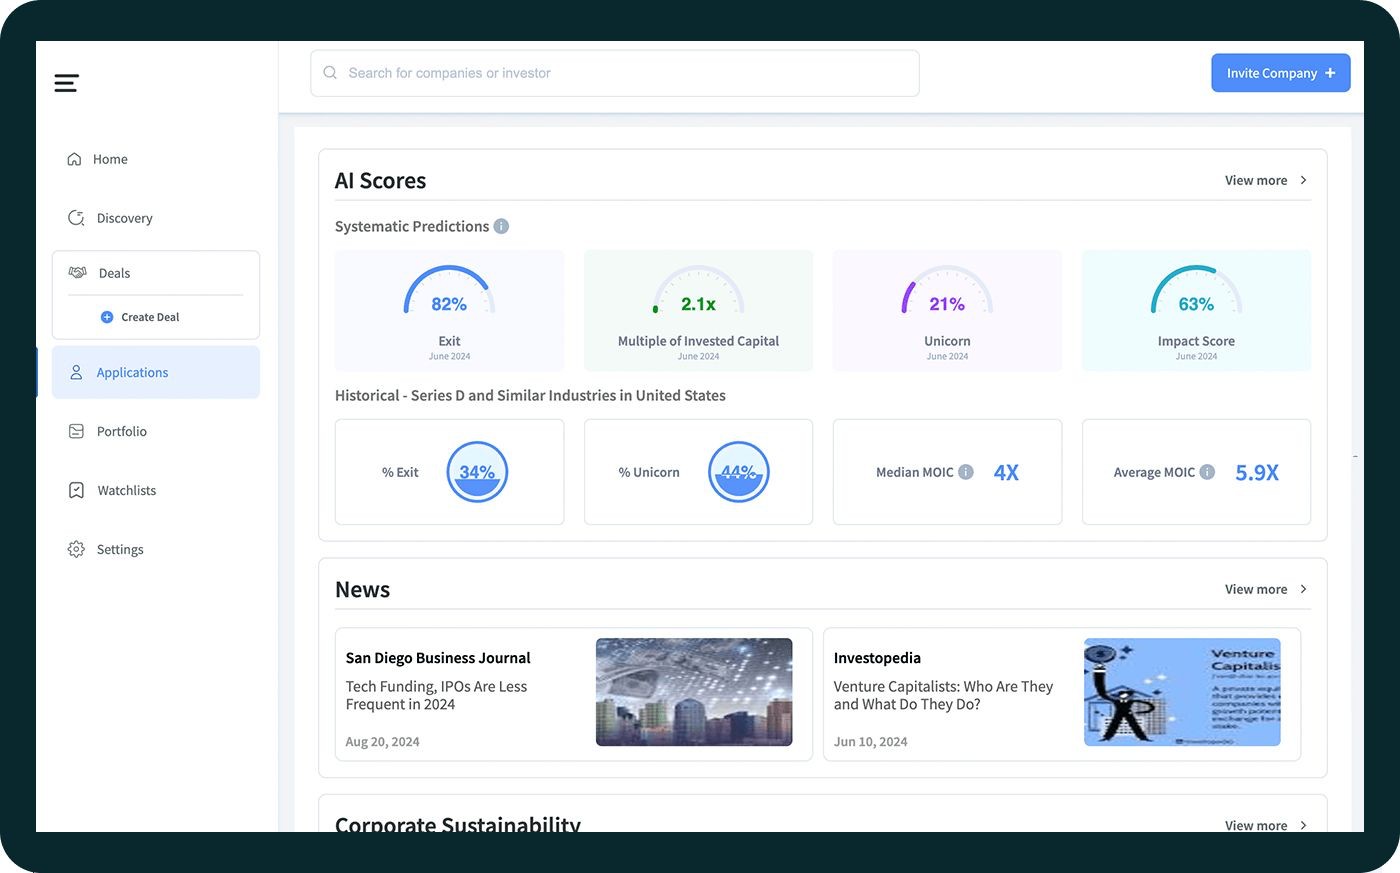
Problem: Prediction scores alone provide a limited view of a company.

Design response: The insights screen places AI scores beside historical comparisons and relevant news, supporting a broader review of the information.

04 / Comparison

Make dense information scannable.

Problem: Reviewing multiple companies means keeping track of many different indicators.

Design response: Aligned table columns, labeled metrics, trend indicators, sorting controls, and pagination structure the comparison experience.

05 / Administration

Connect status to the record.

Problem: Administrators need to move between application status, investor lists, and individual records.

Design response: An overview dashboard, investor-management table, and editable profile screens connect those administrative tasks.

06 / Consistency

Keep the experience familiar.

Problem: A broad portal needs consistent navigation and visual hierarchy across its different workflows.

Design response: Persistent navigation, repeated layouts, and supporting component and style-guide pages establish a shared interface language.

Investment information

Company context. Connected insights.

Systematic Ventures company overview showing introduction, mission, industry, competitors, and funding

Company overview

Company background, market context, and funding information organized within a tabbed profile.

Systematic Ventures company insights showing AI scores, historical comparisons, and news

Company insights

Prediction scores, historical comparisons, and related news presented together.

Company information and values shown are interface examples.

Transaction management

From financial overview
to individual records.

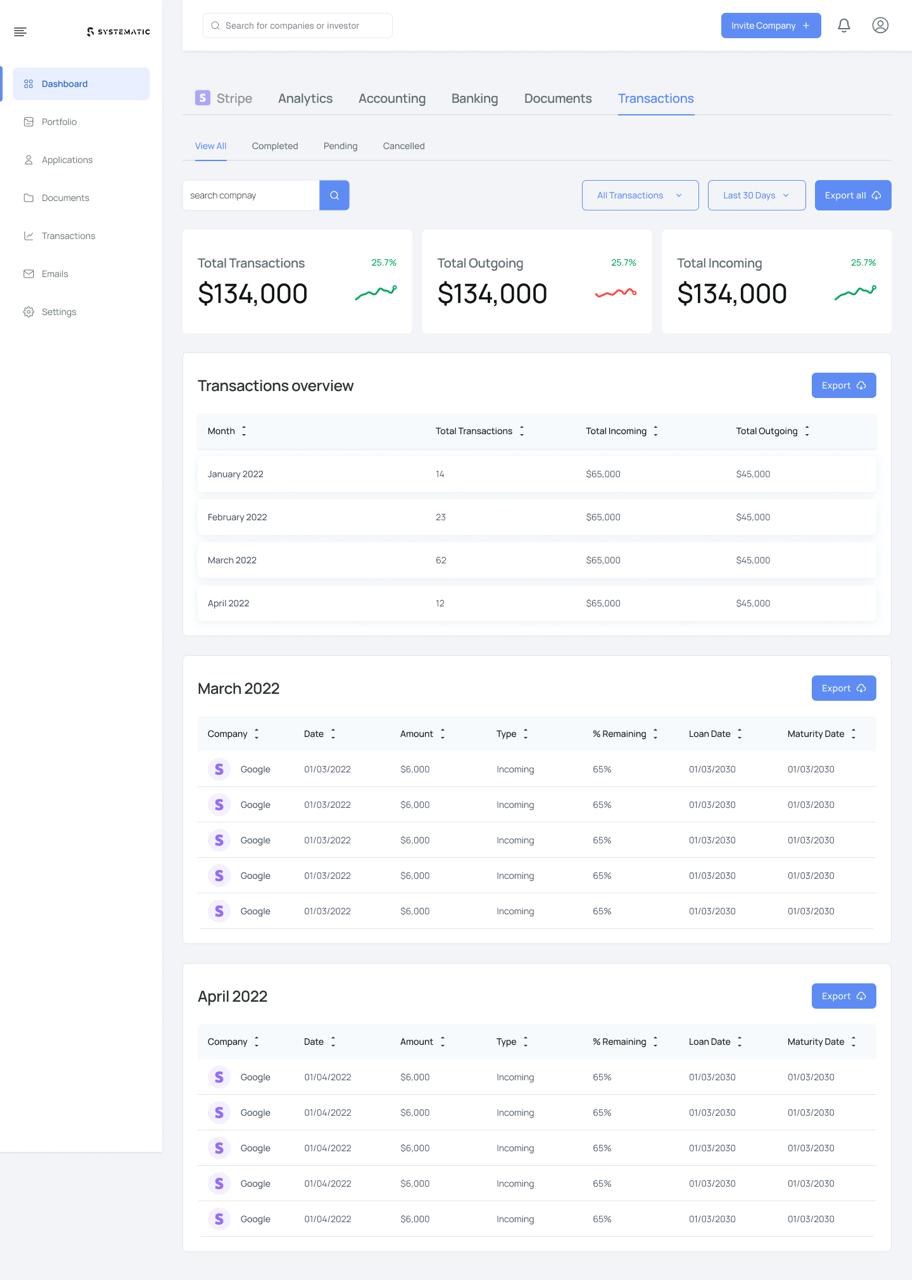
Systematic Ventures transaction dashboard with status tabs, company search, date filters, incoming and outgoing summaries, monthly overview, and detailed transaction tables

Transaction dashboard

Status tabs, company search, transaction and date filters, and export controls organize the review experience. Summary cards lead into monthly totals and detailed records for incoming and outgoing activity.

Financial values shown are interface examples.

The process / 12 weeks

From discovery
to final handoff.

Weeks 1–3 / Discovery

Understand both sides.

User interviews, personas, journey maps, competitive review, and information architecture.

Weeks 4–6 / Wireframing

Shape the core journeys.

Wireframes, core user flows, navigation, and stakeholder review.

Weeks 7–10 / Visual design

Build the visual system.

High-fidelity screens, responsive layouts, and a reusable component library.

Weeks 11–12 / Handoff

Test and document.

Interactive prototypes, usability testing, development documentation, and final design handoff.

Two-sided marketplace

Distinct journeys.
A shared design system.

For founders

An application-status dashboard, document upload center, investor matching results, and messaging.

For investors

A deal-flow dashboard, search and filtering, startup comparison views, and portfolio management.

ILMG · UI/UX & Product Design